Sep 8, 2010

男士健康及美容產品市場概況

在女性為主導的護膚品及美容市場,針對男性用家的健康及美容產品於近兩年迅速冒起。截至2010年7月,健康及美容產品廣告商單單投資在本港網上橫額廣告(Banner Ad,後稱「網上廣告」)的廣告媒體費用(ad spend,後稱「廣告費用」)已達3,500萬港元*,其中有關男性健康及美容產品約佔300萬港元*,為健康美容產品市場總額的百分之九,同時較2009年全年男性健康及美容產品的「廣告費用」上升百分之三十六。在2010年首7個月共約40個相關「網上廣告」,較上年同期增加5成,數目亦已超過2009年全年相關「網上廣告」數目的總和。

圖一: 2009/ 2010年男性健康美容產品「網上廣告」數目及「廣告費用」比較


無論以「廣告費用」或「網上廣告」數目計算,首三名男性健康美容產品廣告商在兩年間都出現了較大的變化。於2009年,MSC皮膚護理中心(Men’s Skin Centres)、倩碧(Clinique)和歐碧泉(Biotherm)高踞首三位,它們的「廣告費用」已佔男性健康美容產品「網上廣告」市場總額的七成。而2010年,除了MSC皮膚護理中心(Men’s Skin Centres)保持於榜首外,Gatsby 和巴黎歐莢雅(L’Oreal Paris)分別進佔第二和第三位,「廣告費用」約各佔市場的百份之二十。另外,以「網上廣告」數量計算,除了主打男性護膚品的LABS SERIES由去年榜尾攀升至今年第三位,其餘排名與按「廣告費用」計算的結果大致相同。

圖二: 2010年按「廣告費用」計算的首10名男性健康美容產品品牌


市場評論

(一)男性健康美容產品品牌在「網上廣告」策略上個別發展

在健康美容產品業中,以女性主導的市場無疑較男性市場成熟,男性市場的潛力及空間仍有待進一步開發,是以男性健康美容產品品牌在使用「網上廣告」作市場推廣的發展迴異,策略和「網上廣告」預算變化亦較大。若以「廣告費用」計算,雖然投資在「網上廣告」的金額較去年同期錄得倍數的增幅,2010年首七個月的「廣告費用」較同期上升約2.5倍,但也有品牌在2009年後,至今暫未有「網上廣告」推出,例如露得清(Neutrogena)和CRABTREE & EVELYN等。另外,以巴黎歐莢雅(L’Oreal Paris)和碧柔(Bioré)為例,「廣告費用」則較去年升逾100%及250%,遠高於年度增長的百分之三十六。反之,倩亮(Clinique)較去年同期出現負增長近百分之一百。而兩年位於榜首的MSC皮膚護理中心(Men’s Skin Centres)在「網上廣告」方面則有較平穩的發展,今年「廣告費用」較同期略升百分之六;而在媒體策劃(Media Plan)上,MSC皮膚護理中心(Men’s Skin Centres)於2010採用了更集中的策略,多選用YahooHK!、Atnext.com等大眾網站,拼棄一些主題網站,如DCFever、Price.com.hk等,更針對品牌在大眾市場(Mass Market)的網上曝光率(Online Exposure)。

(二)「網上廣告」宣傳活動性質的變化

男性健康美容產品宣傳活動性質在2010年起了明顯的變化。去年,品牌多於網上作銷售推廣 (Sales Promotion)及產品宣傳(Product Promotion),例如優惠劵下載或免費試做/ 試用(Free Trial)等的推廣,分別佔去年男性健康美容產品「網上廣告」總數量的一半。反觀今年的情況,品牌以提升顧客參與度(Customer Engagement)作為宣傳策略重點,例如登記參與網上遊戲或上載相片到宣傳活動網頁等,佔今年相關「網上廣告」數量的三分二。

總結

男性健康美容產品「網上廣告」在2010年首7個月錄得明顯的升幅,「廣告費用」達健康美容產品業總額約一成,以男性為目標客戶的市場於業內正逐漸擴大。然而,各品牌於「網上廣告」的推廣策略發展分歧,或與男性健康美容產品市場內各品牌定位仍有待進一步清晰有關。若以現時的增幅推算,2010年度男性健康美容產品「網上廣告」的「廣告費用」總額將達500萬*港元。

*取近似值百萬位

(資料來源: www.admomo.com )


Aug 26, 2010

2010 Q2 Industry Report – Steady growth recorded in Online Display Advertising Campaigns

Market Overview

The online display advertising market for 2010 Quarter 2 (Q2) in Hong Kong recorded a positive growth in the aspect of the number of campaigns and total ad spend. In 2010Q2, the industry summed up to a total of HKD$198 million in ad spend and 3,300* campaigns; which increased by 25% and 17% respectively when compared to Quarter 1(Q1), and rose by 23% and 11% respectively according to that in 2009Q2. There were 1,500* advertisers participated in those campaigns; which was 12% more than that in the previous quarter; while it dropped by 39% in accordance with that in the same period in 2009.

Chart 1: Online Display Advertising Campaigns in 2010Q1 and 2010Q2

Chart 2: Top 15 publishers in 2010 Q2 by ad spend
There was no significant change in the list of top publisher and top industry from 2010 Q2 to Q1. Yahoo!HK and Atnext.com were still the top publishers in 2010Q2 grouped by ad spend and amounted a total of HKD$60 million and more; whilst Yahoo!HK, Discuss.com.hk and Uwants remained top 3 publishers on the list by number of campaigns accounted for 1,900* in total. It reflects that the strategy for most advertisers focus on mass market to enable high exposure. On the other hand, there is no change in the top 5 industry by ad spend, still led by Accounting/Finance/Insurance industry, followed by Travel and Accommodation industry, Computer and Electronic Products industry, Education and Learning, and lastly Shopping and Retail industry.

When examining the period of the first 6 months in 2010 and 2009 full year, it showed no surprise in market growth or drop that both total ad spend and number of campaigns were half as that in the previous whole year. The significant change found in the number of advertisers only; for those the figure in 2010Q1&Q2 was one-third as that in 2009 full year.

Market Highlights

1) The trend of higher ad spend per campaign and per advertiser

The higher growth rate in ad spend (25%) than that in number of campaigns (17%) and number of advertiser (12%) implied the trend of higher ad spend per campaign and ad spend per advertiser. More diversified media plan was adopted by using more channels to promote one single campaign in order to increase the gross impressions from advertiser's perspective. From www.admomo.com, comparing 2010 Q1 and Q2, the ad spend per campaign shows an apparent growth in Automotive industry (144.1%), Household (135.3%) and Health and Beauty industry (42.3%) in ad spend.

2) Appearance of new-new advertisers

Though the number of advertisers in 2010Q1&Q2 was only one-third of that in 2009 full year, the online display advertising industry was supported by uprising number of new-new advertisers, for whom their banner ads were firstly found in Hong Kong in 2010Q2. They dispersed in Health and beauty industry, Shopping and retail industry, Accounting/Finance/Insurance industry and Education/Learning industry. More international brands, like Dunhill, Aigle and Sport.B, and brands from Mainland China, e.g. Fudan University and Agriculture Bank, newly participated in Hong Kong online display advertising market in 2010Q2. Meanwhile, the ad spend from those new-new advertisers was relatively high. For instance, Sport B., a new line under Agnes'b, already spent around HKD$1M solely in 2010Q2 and 3 campaigns held. Also, Fudan University, one of the famous universities from China, invested totally HKD$833K in just one campaign in the same period.

To conclude, there is a sign of positive growth in terms of ad spend per campaign, as well as ad spend per advertiser in 2010Q2 and the trend is likely to continue in the following quarters due to the expanding online channels and digital marketing budget of advertisers. It is also suggested that more global brands will participate in local online display advertising market, known as new-new advertisers to earn their brand awareness in Hong Kong. To gather more information on online display advertising, please visit our website via http://www.admomo.com/.

* Figures rounded to hundred

Aug 11, 2010

McDonald's Purchasing with Free Coca Cola Glass Promotions 2009/2010. Which year achieved greater impact on the market?

McDonald's launched purchasing with free Coca Cola Glass Promotions in 2009 and 2010 respectively. We will compare these two years' marketing strategies, online exposure and achieved results in terms of online advertising, website traffics and e-buzz.

A. Comparison on Online Advertising


2009/10 Campaign Creative


The scale of 2010's promotion is comparatively larger than the previous one in 2009 in terms of number of creative and number of publishers. Both 2009's and 2010's strategies focused on the mass market that revealed in the selections of publishers. In comparison, 2009's marketing strategy also targeted on the young generation that included some online games and sports related websites like NBA, HK RGOAL and Sun Zone in the media plan. In 2010, it extended the focus on the mass market by adding Discuss.com.hk and ON.CC on the publisher list.

B. Comparison on Website Traffic

After launching 2009's campaign, Alexa's statistics shown that the promotion triggered a peak of daily reach in the official website. Compared to the one in 2010, there was no significant change on website traffic during the promotion period.

C. Comparison on E-Buzz


2009's campaign aroused a tremendous e-buzz on the campaign launch day. It recorded 750 posts in one single day in numerous forums and blogs. During the campaign period, 576 topics and 3,586 posts were shown in 37 portals. There were totally 1,877 visitors involved in the discussions and 940,000 people who read the posts. In the period of the two campaigns in 2010, online posts cannot even reach one-fourth of the previous promotion whenever compared to the number of related topics, number of posts and people who involved in discussions. In terms of online coverage, although it is better than 2009's one that related posts were traced in more forums, 40 in total. Only 150,000 people recorded who read the related posts and it greatly decreased by 84%.

Conclusion

It is no doubt that the scale of 2010's campaign is relatively larger than 2009's. However, in terms of website traffic and e-buzz, the result of campaign does not perform as well as 2009's. McDonald's re-launched “Purchase with free Coca Cola Glass” campaign, yet it cannot alter the fact in lack of freshness and excitement even when repackaging as 2010 FIFA Coca Cola Glass. Utilising the boom of FIFA as strategy, but it ultimately resulted in a competition on gaining market interests and disperses mass focus on the campaigns.


(Source by Admomo & K-matrix)

Jul 29, 2010

傳統品牌 創新營銷(二)

傳統品牌在網上廣告的資源投放上仍有待進一步的開發。以嘉頓為例,在2010首季度的營銷活動中,都未有作網上宣傳。然而在傳統品牌的營銷項目中,網上渠道的運用正逐漸增加,除了網上廣告外,它們更利用網上遊戲作銷售推廣。

圖一:2010年嘉頓的網上廣告概況

案例二:嘉頓「Roll唔停贏巨奬」活動

活動日期:2010年5月至6月

活動內容:活動期內每購買一件指定產品,可憑發票資料參加一次「Roll唔停贏巨奬」網上遊戲,數量不限。每週得分最高及累計得分最高的參加者可獲電子產品奬賞。

網上宣傳:

1) 橫額宣傳 – 2010/05/24至2010/07/01


2) 活動網頁


3) 網上遊戲


活動短評:

這個營銷活動反映了網上宣傳,除可增加品牌/ 產品的知名度外,亦可以做到刺激消售的目的,並加強商戶與顧客之間的互動。網上遊戲可令營銷活動內容更豐富,增加活動的趣味性,從而帶動大眾的討論,吸引市場目光。相對從前寄回發票/吉包參加大抽奬等的推廣模式,網上推廣為營銷活動帶來了更多各式各樣的可能性。然而,是次活動的推廣宣傳,橫額廣告只在Uwants及YahooHK刋登、宣傳未有使用社交媒體、電視廣告以產品為焦點等……或未有足夠渠道讓大眾接觸相關活動的資訊。建議可加強在討論區或社交媒體的宣傳,以吸引更多人參與活動。


Jul 22, 2010

傳統品牌 創新營銷(一)

與傳統媒體比較,網上營銷提供了一個互動的平台,使品牌與大眾聯繫。網上營銷活動的效益,往往不是大灑金錢換取,而是由創意主導。在主要網站舖天蓋地/密集式的橫額廣告(Banner Ad),無疑可在短時間內增加品牌知名度,但在計算投資回報(ROI)時,便會發現往往「入不敷支」。創新的意念、善用互聯網的特性,才是成功網上營銷的不二法門。


在2010年,一些傳統品牌就以嶄新的方式進行營銷活動,包括維他奶及嘉頓。他們在橫額廣告上花費不高,然而在營銷活動加入了網上元素,大大提升了與大眾/ 客戶的互動,及品牌的網上曝光率(Online Exposure)。


圖一: 2010年1月至6月有關品牌橫額廣告數據


案例一:維他奶「Friend足70年」活動

活動日期:2010年3月至4月

活動內容:維他奶國際就慶祝公司70週年,特別設計了70款新包裝,讓大眾投票選出他們最喜愛的款式。活動內容共分三部份,包括:1) 「個個祝」維他奶大晒冷 – 大眾可揀選心水設計,以電郵方式/通過Facebook送給親友;2) 個個vote大抽奬 – 每週以不同主題投票,例如:「邊盒最爆?」,並於每週投票者中選出大抽奬得奬者;3) My Own Pack設計鬥 – 大眾可於活動網頁以自己設計的包裝參加比賽,並由公眾選出他們最喜愛的設計。


網上宣傳:

1) 橫額宣傳 – 2010/03/05至2010/04/02


2) 活動網頁

3) Facebook專頁

活動短評:

善用社交媒體特性,帶動品牌網上曝光率
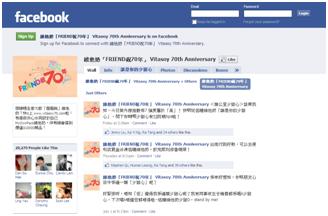
活動網頁與Facebook互動,公眾可於活動網頁登入Facebook,以Facebook帳戶資料進行投票,無須從新登記個人資料。同時在登入Facebook帳戶後,即與「維他奶『Friend足70年』」專頁連結,成為品牌日後與公眾的一個溝通平台。而在專頁發佈的訊息亦會在已連結用戶的動態消息(News Feed)出現,使訊息進一步滲入其朋友群。在是次活動期內,維他奶國際就連結了約20,000名Facebook用戶,若以每用戶50名朋友計算,維他奶在短短一個月內,已在Facebook建立了一個與1,000,000大眾的溝通平台。是次營銷活動結合了社交媒體,不但豐富了活動內容,為活動參與者帶來便利,同時亦為品牌日後在使用社交媒體作宣傳建立了良好的基礎。


(待續)

Social Media Marketing – A Boom of Facebook Campaigns in Hong Kong

A statistics announced in 2010 June that there are 3.4M Facebook users in Hong Kong. Facebook is considered as a platform for timely information exchanges. Marketers keep an eye on this new channel, use it to enhance customer engagement to brands and deliver promotion messages.

For the first 6 months in 2010, there were 64 online display ad campaigns related to advertisers’ Facebook fan pages or Facebook games; while that was only 33 in 2009 the whole year. The total ad spend of these display ad campaigns amounted to HKD 5.8M in 2010, which was 1.5 times of that in 2009 full year, and it is still counting.

Chart 1: Statistics of Facebook-Related Online Display Ads

Among these display ad campaigns in 2009, they were mostly Facebook fan page promotions, intended to recruit fans with some free gifts/ trial products as incentives. However, the campaign content had been changed a lot in 2010. There were more interesting and insightful Facebook-related campaigns, e.g. interactive games or activities. It is suggested that those games/ activities strengthen customer engagements to the brands, and boost up the fan page visit frequency.

Chart 2: Industry of Facebook-related Campaign Advertisers

Shopping/ Retail advertisers involved the most in Facebook-related campaigns. It fit their needs of rapid market response to their promotions and high brand exposure to the mass market.

Chart 3: Ad Spend Forecast on Online Advertising of Facebook-Related Campaigns

It is expected that there will be increasing number of Facebook-related display ad campaigns launched this year, as well as an increase in total display ad spend those campaigns to HKD10M at the end of 2010.

2010 World Cup Related Online Campaigns

There is a football fever around the world due to 2010 World Cup. Since December 2009, few advertisers had started their online advertising campaigns which were related to World Cup/ football. By June 18, a week after 2010 World Cup started, there were 57 online advertising campaigns, with amounted 3.6 million ad spend, launched by 44 advertisers in Hong Kong.


Chart 1: Number of Campaigns & Total Ad Spend by Industry.


Shopping/ Retail was the top industry launched World Cup/ football related online advertising according to the number of campaigns, followed by Food/ Beverage and Entertainment industries. There were 18, 12 and 8 campaigns launched during the period respectively. Whilst Food/ Beverage was the top industry in terms of ad spend; that it spent 1.4 million on those campaigns.


Nike, Adidas and McDonald’s were the top three advertisers in terms of number of World Cup/ Football related campaigns; that they had launched 5, 4 and 3 campaigns respectively. When comparing with total ad spend, McDonald’s was the top advertisers among the others, who spent around 740K on the campaigns, followed by Visa and Sony.


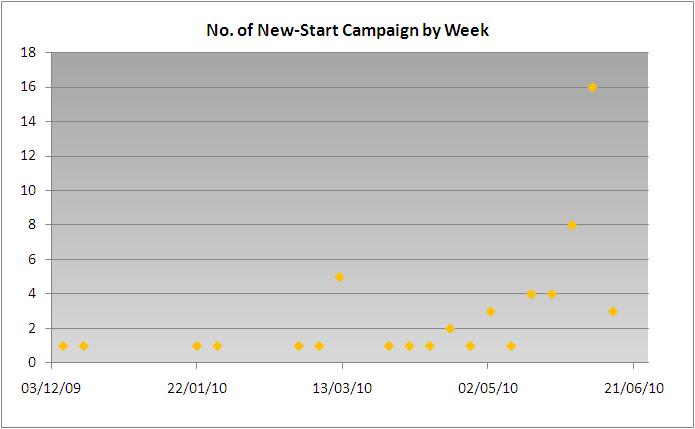
Chart 2: Number of New-Start Campaign by Date


World Cup/ Football related campaigns were mainly started after April, and the peak of new-start campaigns was the week after World Cup opened. There were 16 new campaigns launched within one single week; while there were 8 new campaigns launched in the week when World Cup opened. There were totally 38 World Cup/ Football related campaigns running during the period.


For promotion gimmicks, lucky draws, prized World Cup quiz games, and redemption of limited World Cup souvenirs were commonly found, apart from some direct product/ service promotions, e.g. Extension of Delivery Service Time Promotion by KFC. There were also some interactive game promotions, either in social networks or company websites, to enhance customer engagement to their brands. Football Matchups Game on Facebook by Adidas, Yahoo! Penalty Shootout Free Online Game Promotion by Budweiser, and Football – Make Your Own Advertisement Clip Promo by Nike, were some examples.


Chart 3: Top Publishers by Ad Spend


For channel usage, there were 143 publishers in total used for those campaigns. Discuss.com.hk, Uwants and Yahoo!HK are the top publishers in terms of number of campaign launched. It reflects that advertisers were more targeting to the mass market. There were 22, 19, and 18 online advertising found on their portals respectively. Yahoo!HK, on.cc and Atnext.com were the top publishers according to total ad spend.


To conclude, 44 advertisers from 8 industries took 2010 World Cup as a gimmick to their promotions; for who spent 3.6 million on online advertising so far. Lucky draws, prized quiz games and limited souvenirs were commonly included in their promotions; while some brands aim to enhance their online brand exposure by providing special designed interactive games, addition to online advertising for their promotions. There is one more month to go before the end of 2010 World Cup. It is expected that there will be more and more related online campaigns in the market, especially in the week of final matches. We look forward to seeing marketers’ creative ideas in coming World Cup related online campaigns.